Lifestyle
Quick facts
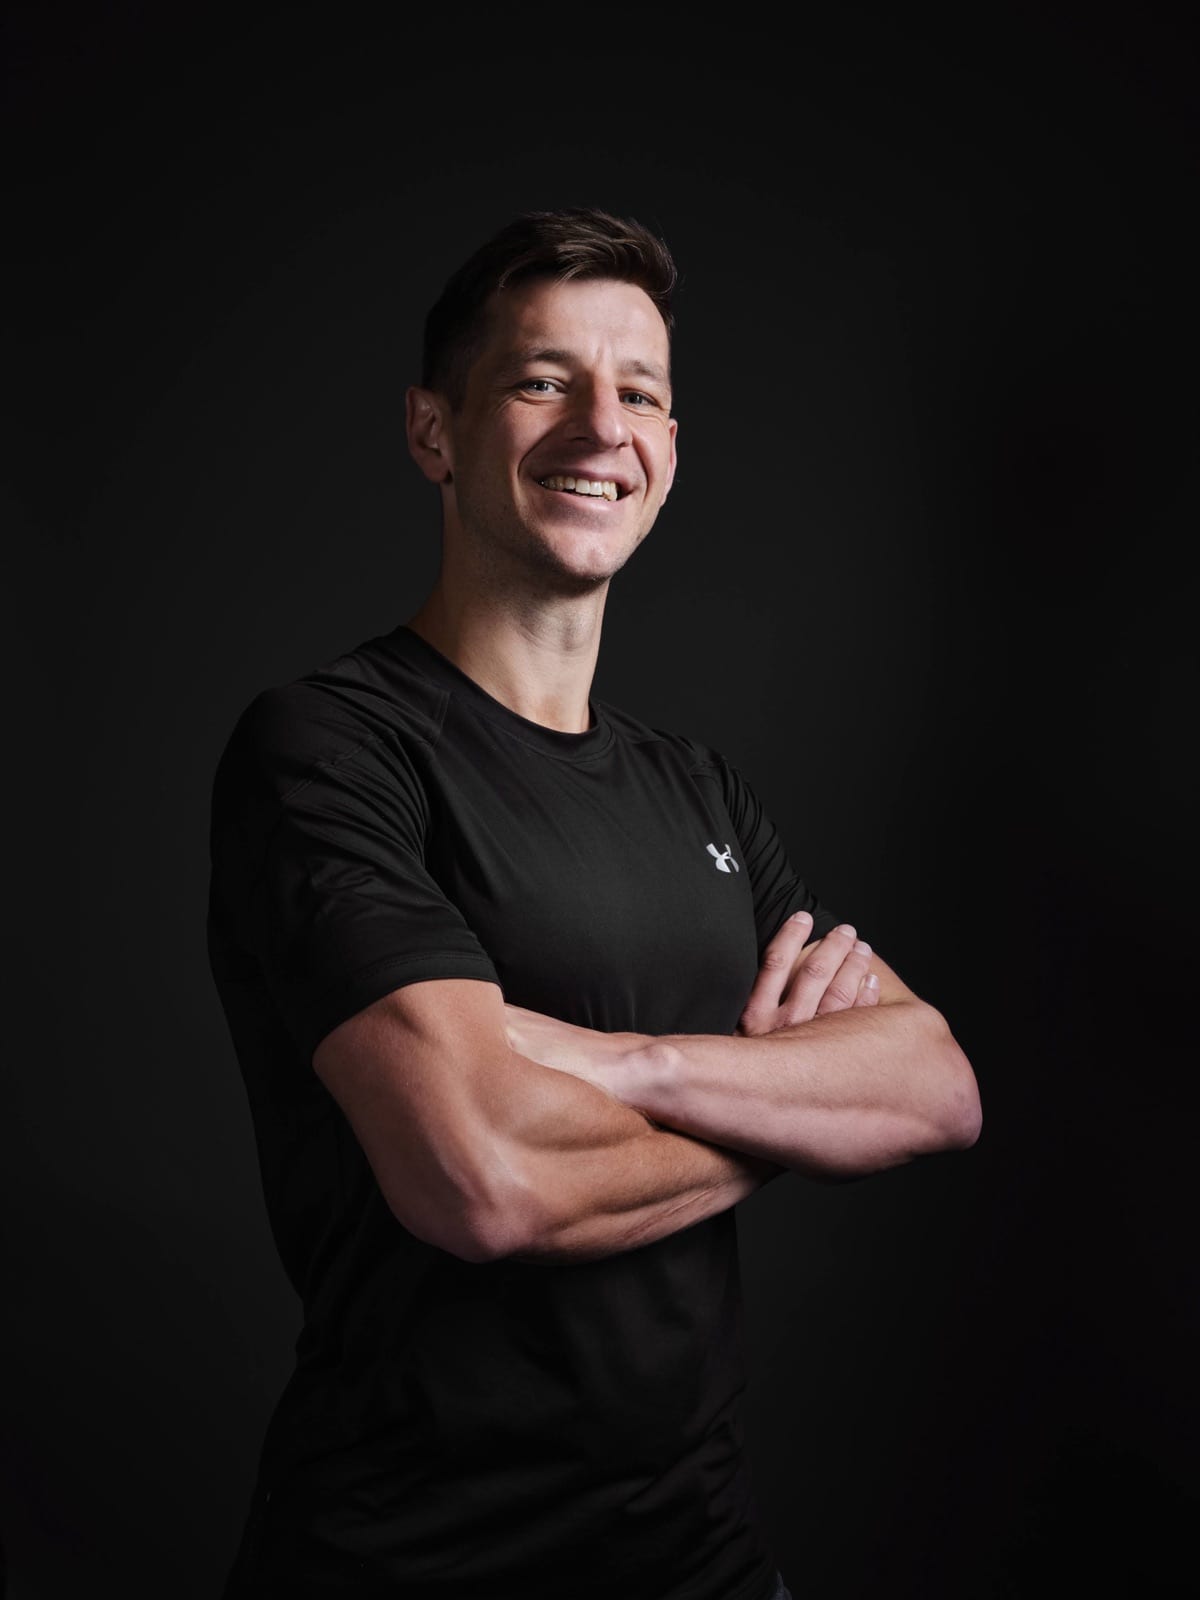


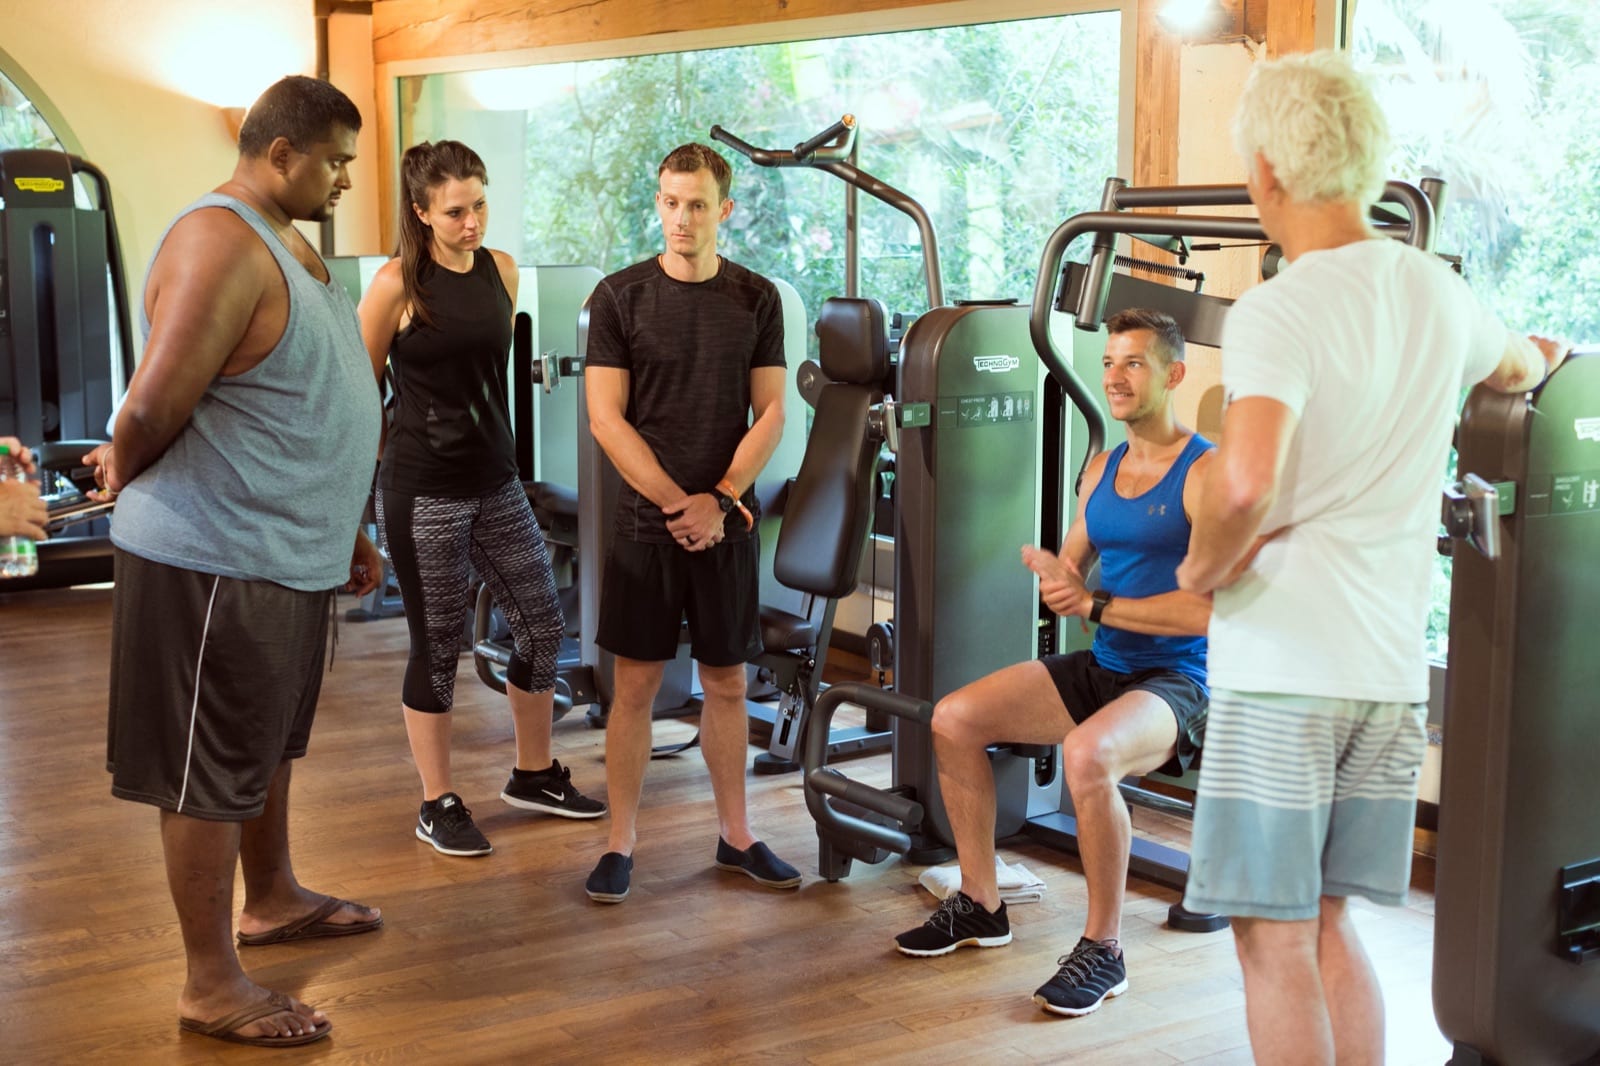
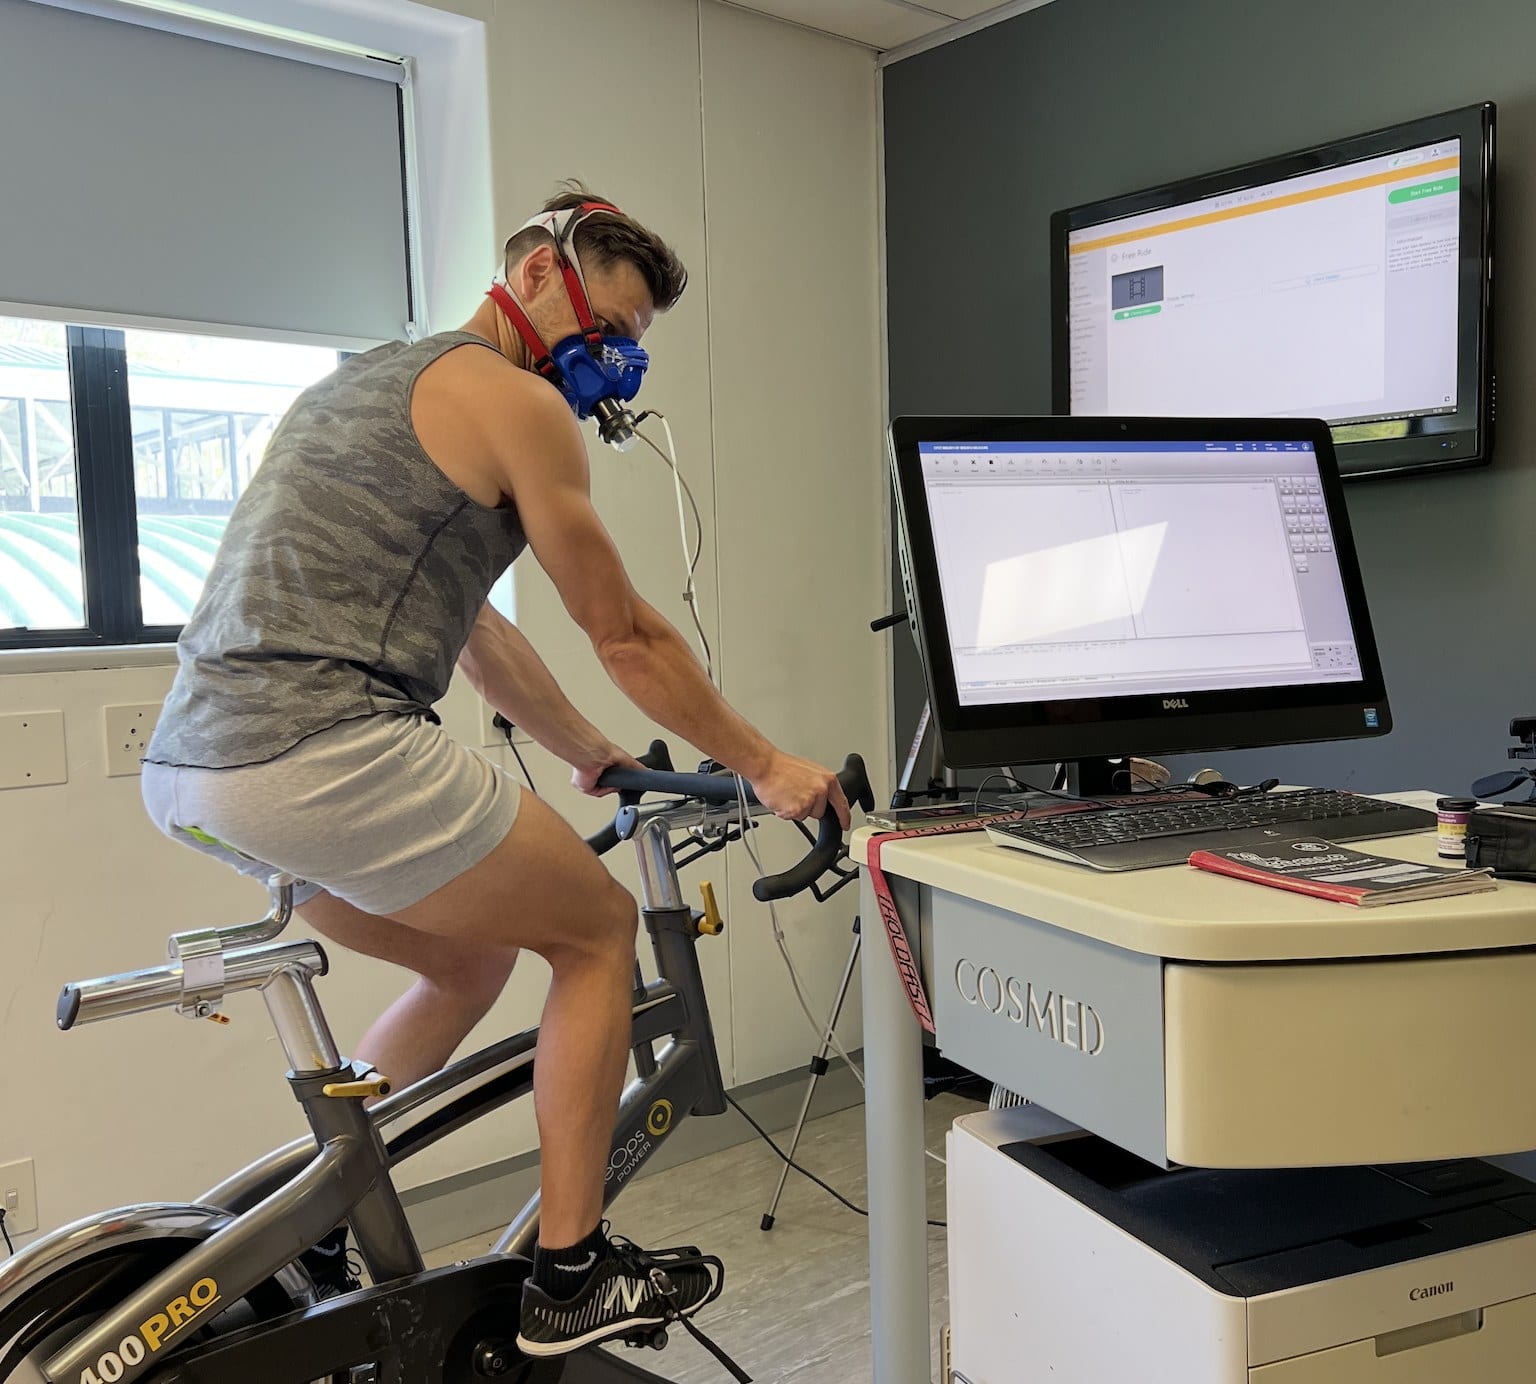
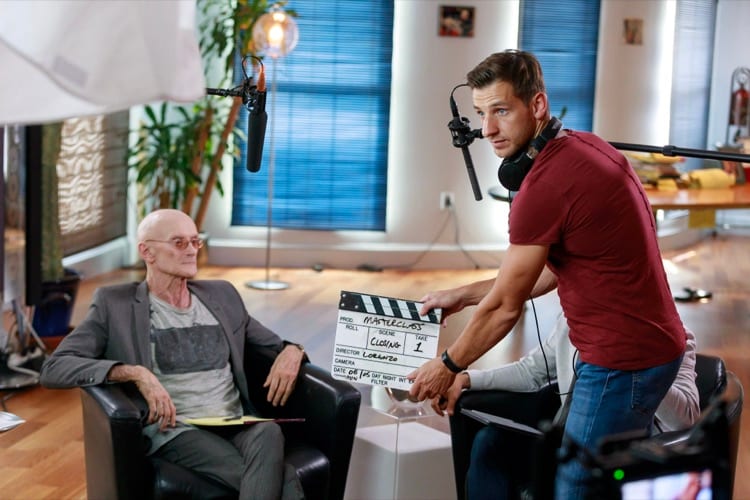
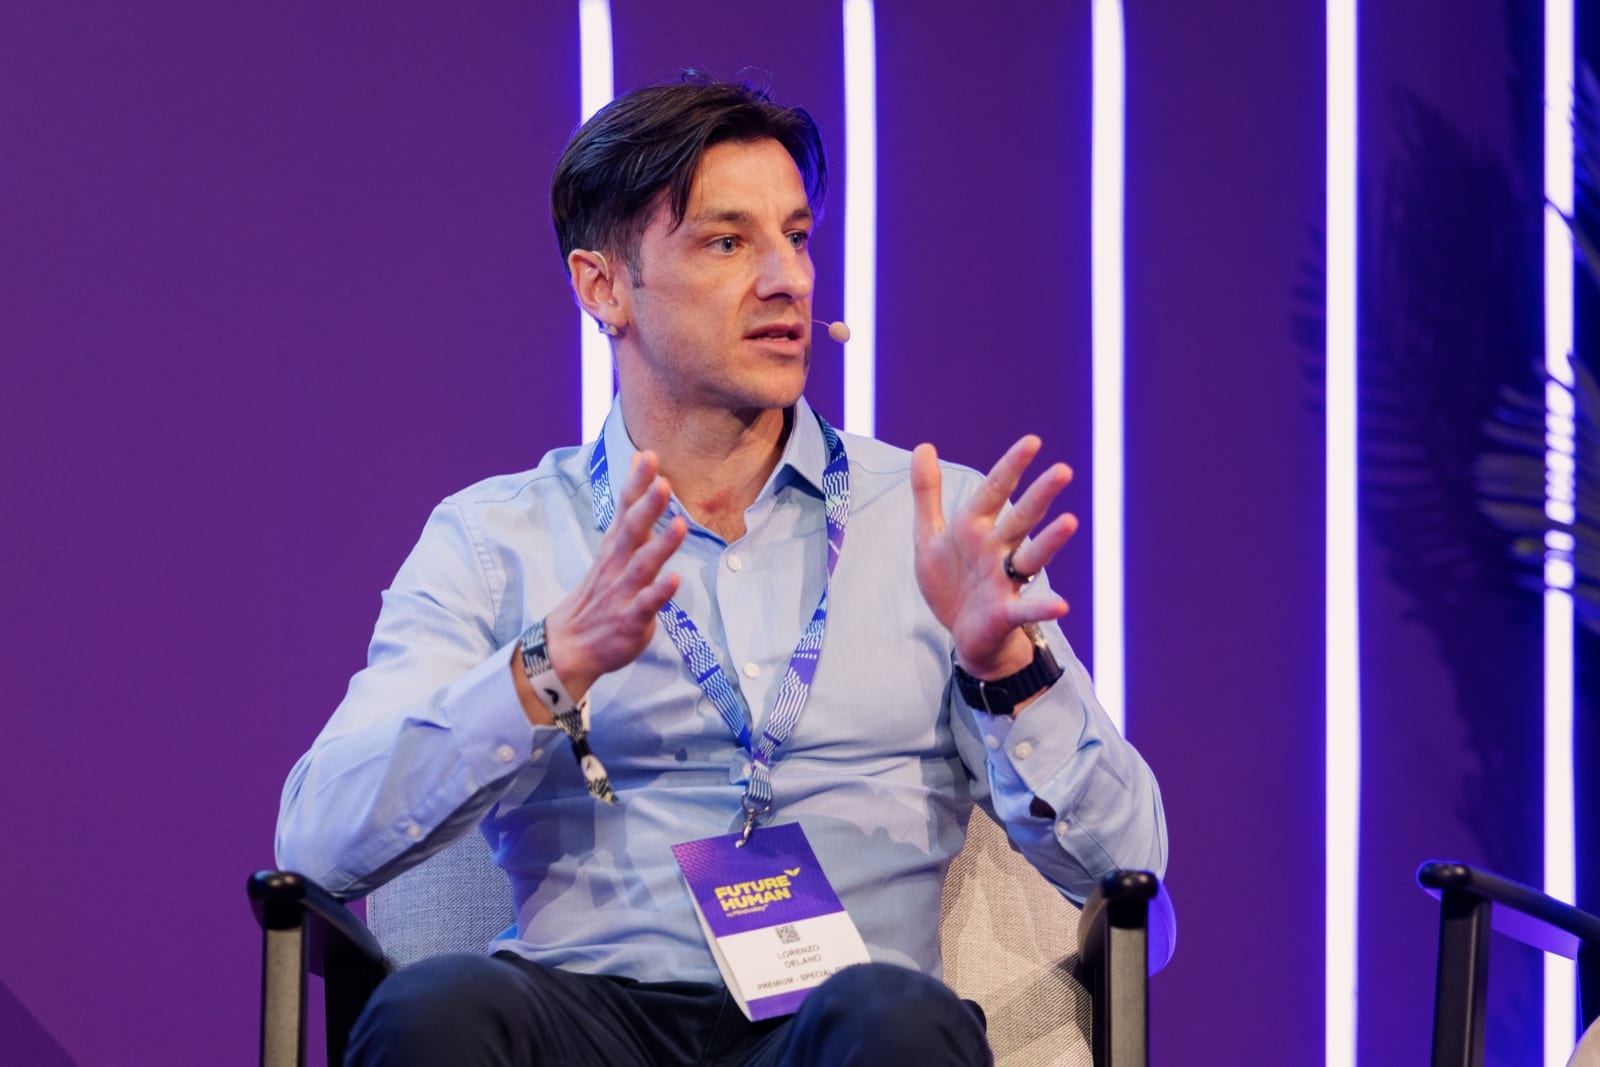
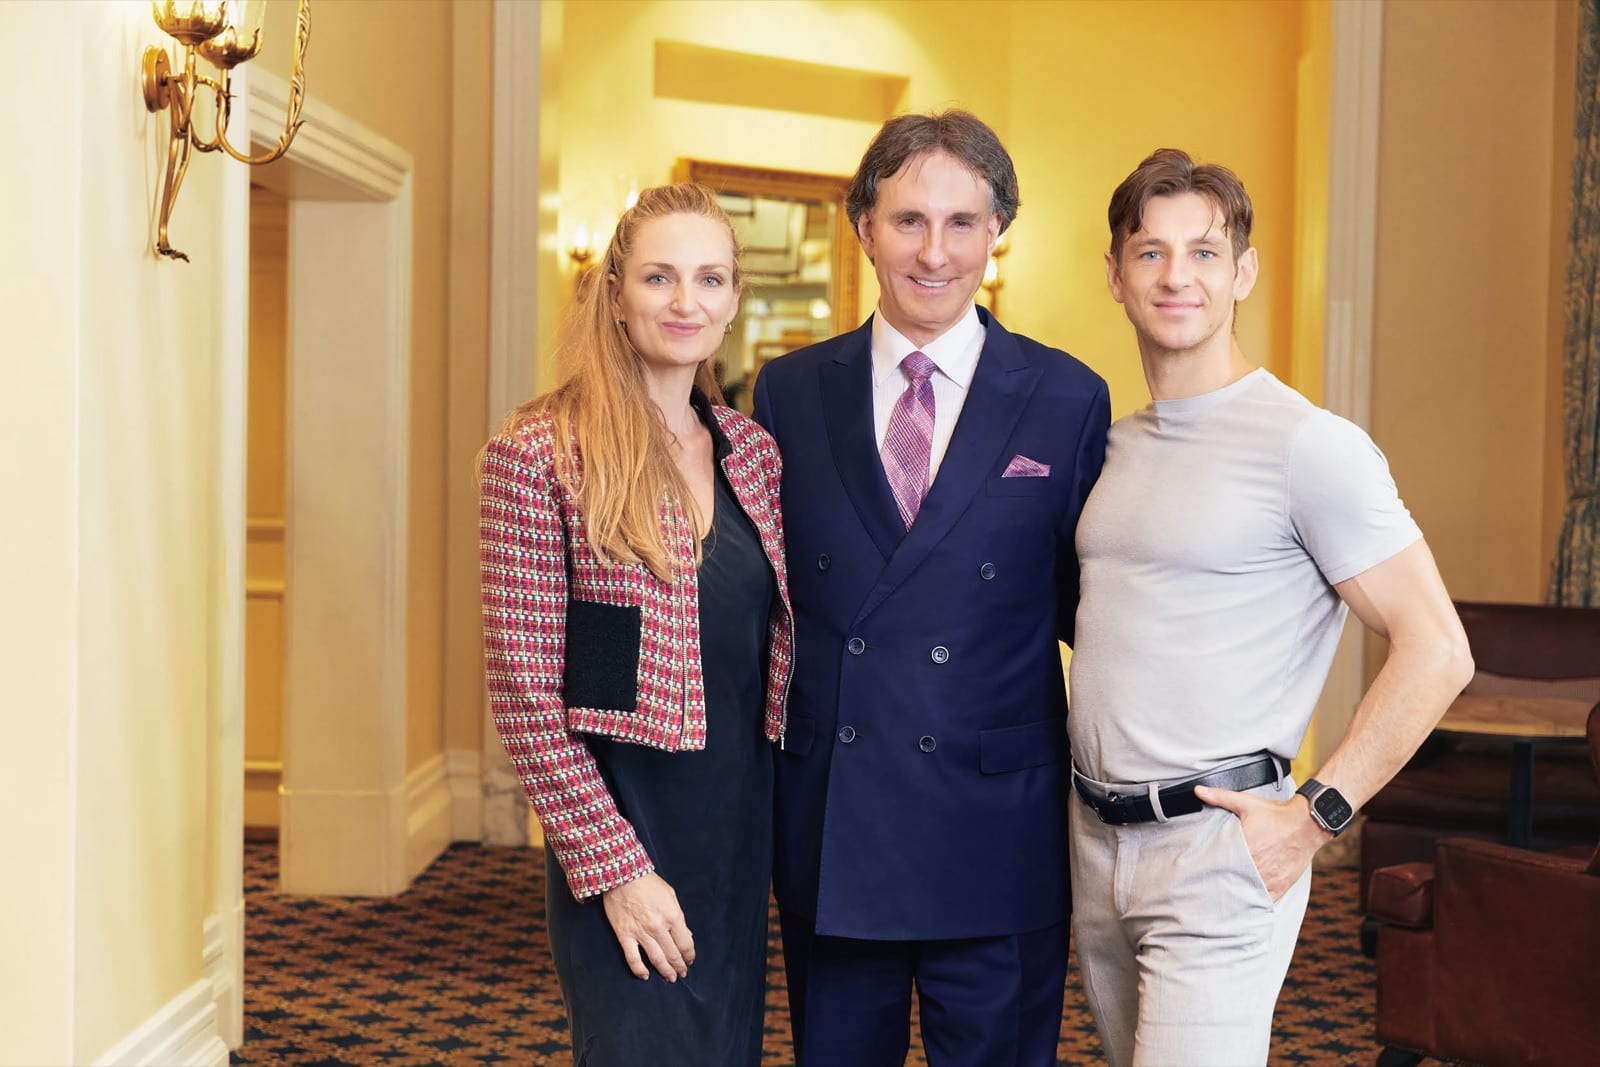
Sociological(Story)
- Born
- Lorenzo Delano7 December 1987 (age 38)Krugersdorp, South Africa
- Phenotype
- Blue eyes and brown hairAverage height (176 cm)
- Ancestry
- Western European (Dutch)
- Ethnicity
- Afrikaner
- Language
- Afrikaans; English; Mandarin
- Citizenship
- South African
Professional(Knowledge)
Psychological(Nature)
- Intelligence
- RIOT: Full-scale IQ 112
- Worldview
- Enlightenment humanist
- Personality
- HEXACO: Disciplined, honest, and curious
- Values
- PVQ: Autonomy, achievement, and universal-care
- Beliefs
- PWB: Good, safe, and improving
- Interests
- RIASEC: Investigative, artistic, and social
Your days are what your years are made of.
Lifestyle refers to the three coordinates of a day: activity (what you do), time (when you do it), and space (where you do it). Your lifestyle predicts your capital: what your hours build, and what they drain.
Hours are fixed at twenty-four; how they are spent, scheduled, and housed is not. Each is best measured by a designed day held against the lived one. To master your lifestyle is to build days that run themselves, then keep them.
Activity (Habits)
What you do is a function of habits (chosen) and needs (fixed), the two best predictors of which capital grows and which drains. Mine: twelve habits, creative work first, hard training matched by recovery, shared hours that ask nothing back.
Knowledge depends on learning which problems matter, then solving them
|
Physical resilience depends on hard loading matched by full recovery
|
Peace of mind depends on keeping my affairs in order and my attention my own
|
Wealth depends on serving people directly and coordinating resources at a distance
|
Physical vitality depends on balancing the energy I take in against what I spend
|
Emotional balance depends on hours that are shared and ask nothing in return
|
Time (Routines)
When you do things is a function of energy (rhythmic) and schedule (chosen), the two best predictors of what gets done and what keeps slipping. Mine: fresh hours for solo work, peak hours for body and people, evenings for loose ends.
The freshest hours are reserved for recovery and the deepest solo work
|
Energy at its highest is spent on the body and on other people
|
The flexible hours: finish what’s open, then eat, connect, and switch off
|
The training split and standing commitments the daily blocks point to
|
Where variety, people, and next-week preparation get their room
|
Space (Resources)
Where you live is a function of conditions (given) and services (chosen), the two best predictors of what your life costs and allows. Mine: Austin, graded on land, market, and people; a home in five layers, from the shell to my bag.
The land’s givens: chosen once, then lived with daily
|
What the market charges and offers at city scale
|
The people of a place: who lives here, and how
|
Five layers by provider: the building’s shell down to my bag
|
The market’s five deliverables, by the kind of provider I use
|
What only the city provides: paperwork, power, movement, institutions, and the outdoors
|
References (Personal)
My lifestyle data derived from continuous and event-based tracking
- Sleep: PPG, thermometry, and accelerometry (continuous); tracks overall sleep quality using heart rate, HRV, SpO₂, respiratory rate, skin temperature, and movement (Oura) • report (app)
- Activity: Accelerometry and ECG (continuous); tracks overall physical activity levels using heart rate and movement frequency, intensity, duration, and direction (Apple Watch) • report (app)
- Nutrition: Weighted food records (events); estimates overall energy and nutrient intake using food measurements against nutrition databases (Cronometer) • report (app)
- Attention: Digital behavioral chronometry (continuous); tracks overall screen time for work, education, management, and entertainment using HCI informatics (Apple devices) • report (app)
My lifestyle’s impact on key measures of life capital
- Health: Functional integrity status (2026); the effects of sleep, exercise, nutrition, walking, and maintenance activities on measures of integrity, balance, and capacity • health (page)
- Knowledge: Applied intelligence status (2026); the effects of work, studying, service, management, and maintenance on measures of education, skills, and works • knowledge (page)
- Wealth: Financial asset status (2026); the effects of service and maintenance on measures of security, efficiency, and growth • wealth (page)
- Network: Social influence status (2026); the effects of service, management, play, and connection activities on measures of nurture, progress, and contribution • network (page)
References (Social)
Public guidelines for human wellbeing
- Sleep: Watson, N. F., et al. (2015). Recommended amount of sleep for a healthy adult. Sleep, 38(6). Seven or more hours. PubMed (opens in a new tab)
- Activity: World Health Organization (2020). WHO guidelines on physical activity and sedentary behaviour. 150–300 minutes moderate weekly. who.int (opens in a new tab)
- Play and connection: World Health Organization (2025). From loneliness to social connection: charting a path to healthier societies. Connection treated as a determinant of health; 871,000 early deaths a year attributed to disconnection. who.int (opens in a new tab)
- Nutrition: USDA and HHS. Dietary Guidelines for Americans, 2025–2030. dietaryguidelines.gov (opens in a new tab)
- Alcohol: World Health Organization (2023). No level of alcohol consumption is safe for our health. No safe amount; less is better. who.int (opens in a new tab)
- Smoking: World Health Organization (2003). WHO Framework Convention on Tobacco Control. The first treaty negotiated under WHO auspices; over 180 parties bound to demand- and supply-reduction measures. who.int (opens in a new tab)
- Work: International Labour Organization (1962). Reduction of Hours of Work Recommendation, No. 116. The forty-hour week as the standard to progress toward, extending Convention No. 47 (1935). ilo.org (opens in a new tab)
- Education: UNESCO (2015). Recommendation on Adult Learning and Education. Lifelong learning across literacy, professional development, and citizenship. unesco.org (opens in a new tab)
- Climate: ANSI/ASHRAE Standard 55. Thermal environmental conditions for human occupancy. ashrae.org (opens in a new tab)
- Air: World Health Organization (2021). WHO global air quality guidelines. PM2.5 and related thresholds. who.int (opens in a new tab)
- Radiation: International Commission on Radiological Protection (2007). ICRP Publication 103. Occupational exposure 20 mSv per year averaged over five years, never above 50 mSv in one; public exposure 1 mSv per year. icrp.org (opens in a new tab)
- Radon: World Health Organization (2009). WHO handbook on indoor radon: a public health perspective. A reference level of 100 Bq/m³, the exposure that varies by where you live. who.int (opens in a new tab)
- Green space: World Health Organization Europe (2016). Urban green spaces and health. The 300 m access recommendation. who.int (opens in a new tab)
- Cost of living: US Department of Housing and Urban Development. The 30%-of-income cost-burden threshold. huduser.gov (opens in a new tab)
Public data derived from population surveys and public indices
- Wellbeing: Gallup World Poll (annual); life evaluation on the Cantril ladder across 140+ countries: the base for the World Happiness Report and the income-to-happiness literature • worldhappiness.report (opens in a new tab)
- Time allocation: American Time Use Survey (annual since 2003); how a national sample spends the twenty-four hours, by activity (BLS/Census) • bls.gov (opens in a new tab)
- Health behavior: BRFSS (annual); the largest continuous health-behavior surveillance system, covering sleep, activity, smoking, and alcohol prevalence by state (CDC) • cdc.gov (opens in a new tab)
- Health and nutrition: NHANES (continuous); interviews, physical examination, and laboratory work on a national sample; its What We Eat in America component is the intake base for the dietary guidelines (CDC/NCHS) • cdc.gov (opens in a new tab)
- Cohort biology: UK Biobank (2006–, ongoing); 500,000 participants with genomics, imaging, and wrist accelerometry: the source behind most step-count and sleep dose-response findings • ukbiobank.ac.uk (opens in a new tab)
- Adult skills: OECD PIAAC Survey of Adult Skills (decennial); literacy, numeracy, and problem solving among adults aged 16–65 across member countries • oecd.org (opens in a new tab)
- Household wealth: Survey of Consumer Finances (triennial); family balance sheets — income, assets, debt, and net worth (US Federal Reserve) • federalreserve.gov (opens in a new tab)
- Climate: NOAA 30-year normals; temperature, humidity, and sunshine • ncei.noaa.gov (opens in a new tab)
- Air: EPA AirNow (daily); AQI and PM2.5 • airnow.gov (opens in a new tab)
- Radiation: Life Span Study (1950–, ongoing); ~120,000 Hiroshima and Nagasaki survivors with individual dose estimates: the primary source informing every international dose limit (RERF) • rerf.or.jp (opens in a new tab)
- Radon: EPA Map of Radon Zones; county-level screening potential from the national residential survey, read alongside a test of the specific address • epa.gov (opens in a new tab)
- Cost of living: C2ER index (quarterly); US average = 100 • coli.org (opens in a new tab)
- Growth: BEA GDP by metro (annual); with BLS wages and Census population • bea.gov (opens in a new tab)
- Safety: FBI Crime Data Explorer (annual); offense and arrest counts reported by agency through the national incident-based system • cde.ucr.cjis.gov (opens in a new tab)
- Healthcare: CMS Care Compare (quarterly); mortality, readmission, safety, and patient-experience measures reported by every Medicare-certified hospital • medicare.gov (opens in a new tab)
- Walkability: Walk Score (live); 0–100 by amenity distance • walkscore.com (opens in a new tab)
Public evidence of lifestyle’s impact on longevity and wellbeing
- Lifestyle (combined): Li, Y., et al. (2018). Impact of healthy lifestyle factors on life expectancies in the US population. Circulation, 138(4). Five low-risk factors; 14.0 years for women, 12.2 for men. PubMed (opens in a new tab)
- Sleep: Cappuccio, F. P., et al. (2010). Sleep duration and all-cause mortality: a systematic review and meta-analysis. Sleep, 33(5). PubMed (opens in a new tab)
- Activity: Arem, H., et al. (2015). Leisure time physical activity and mortality: a detailed pooled analysis of the dose-response relationship. JAMA Internal Medicine, 175(6). 661,000 adults; benefit plateaus at three to five times the guideline minimum. PubMed (opens in a new tab)
- Play and connection: Holt-Lunstad, J., Smith, T. B., & Layton, J. B. (2010). Social relationships and mortality risk: a meta-analytic review. PLoS Medicine, 7(7). 308,849 participants; strong relationships raise survival odds by half. PubMed (opens in a new tab)
- Nutrition: Estruch, R., et al. (2018). Primary prevention of cardiovascular disease with a Mediterranean diet supplemented with extra-virgin olive oil or nuts. New England Journal of Medicine, 378(25). PREDIMED; 7,447 randomized, a rare dietary trial rather than a cohort. PubMed (opens in a new tab)
- Alcohol: GBD 2016 Alcohol Collaborators (2018). Alcohol use and burden for 195 countries and territories, 1990–2016. The Lancet, 392(10152). 694 surveys and 592 studies; risk rises monotonically from zero. PubMed (opens in a new tab)
- Smoking: Doll, R., Peto, R., Boreham, J., & Sutherland, I. (2004). Mortality in relation to smoking: 50 years’ observations on male British doctors. BMJ, 328(7455). Smokers died about ten years younger; quitting at 30 recovered nearly all of it. PubMed (opens in a new tab)
- Work: Marmot, M. G., et al. (1991). Health inequalities among British civil servants: the Whitehall II study. The Lancet, 337(8754). 10,314 civil servants; health tracks job control, not just income. PubMed (opens in a new tab)
- Education: Case, A., & Deaton, A. (2021). Life expectancy in adulthood is falling for those without a BA degree. PNAS, 118(11). The educational divide in mortality more than doubled between 1990 and 2018. PNAS (opens in a new tab)
- Wealth: Chetty, R., et al. (2016). The association between income and life expectancy in the United States, 2001–2014. JAMA, 315(16). 1.4 billion tax records; 14.6 years between the richest and poorest one percent. PubMed (opens in a new tab)
- Climate: Sterling, E. M., et al. (1985). Criteria for human exposure to humidity in occupied buildings. ASHRAE Transactions, 91(1). The 40–60% band.
- Air: Dockery, D. W., et al. (1993). An association between air pollution and mortality in six US cities. New England Journal of Medicine, 329(24). The Harvard Six Cities study; the basis of the American fine-particle standard. PubMed (opens in a new tab)
- Radiation: Ozasa, K., et al. (2012). Studies of the mortality of atomic bomb survivors, Report 14, 1950–2003. Radiation Research, 177(3). The dose-response that sets the limits. PubMed (opens in a new tab)
- Radiation (occupational): Richardson, D. B., et al. (2015). Risk of cancer from occupational exposure to ionising radiation (INWORKS). BMJ, 351. 309,932 nuclear workers; risk persists at low dose rates. PubMed (opens in a new tab)
- Radon: Darby, S., et al. (2005). Radon in homes and risk of lung cancer: collaborative analysis of individual data from 13 European case-control studies. BMJ, 330(7485). 7,148 cases; 16% more risk per 100 Bq/m³, linear with no threshold. PubMed (opens in a new tab)
- Green space: James, P., et al. (2016). Exposure to greenness and mortality in a nationwide prospective cohort of women. Environmental Health Perspectives, 124(9). PubMed (opens in a new tab)